GoldenGate OCI Metrics Grafana - Visualization of GoldenGate Metrics in Grafana
Grafana is an extensively used open-source platform for analytics and data visualization. Its intuitive user interface, robust query language, and ability to connect to a diverse range of data sources have made Grafana a preferred tool for monitoring and analyzing various data types, ranging from servers, applications, IoT devices to business metrics. Irrespective of where the data resides or the type of database used, Grafana is a versatile tool that can seamlessly integrate with it.
Grafana supports OCI as a data source, to query and visualize data stored in OCI services like Oracle Database, Object Storage, GoldenGate and other services. To use OCI as a data source in Grafana, we will need to configure an OCI data source in Grafana using the appropriate credentials and settings.
Once configured an OCI data source in Grafana, we can use it to create dashboards and panels that display OCI data in various formats like charts, tables, and graphs. We can also set up alerts in Grafana based on OCI data to notify you of important events or issues.
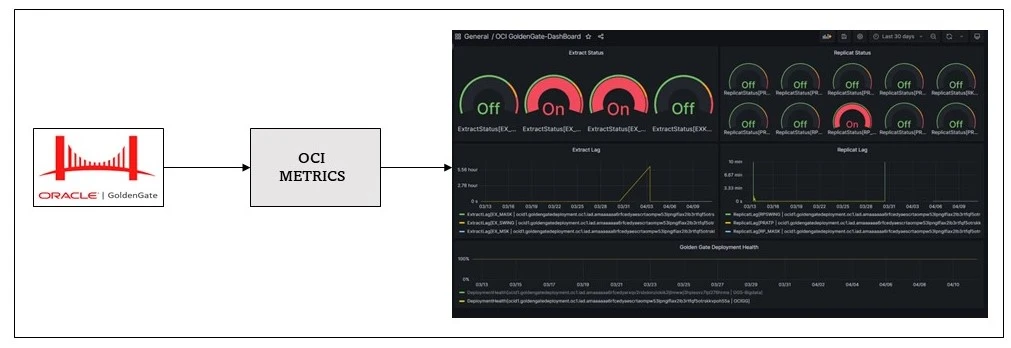
In this blog post, I will demonstrate how to use Grafana for real-time monitoring and visualization of GoldenGate data from OCI metrics. The following topics are covered.
Grafana supports OCI as a data source, to query and visualize data stored in OCI services like Oracle Database, Object Storage, GoldenGate and other services. To use OCI as a data source in Grafana, we will need to configure an OCI data source in Grafana using the appropriate credentials and settings.
Once configured an OCI data source in Grafana, we can use it to create dashboards and panels that display OCI data in various formats like charts, tables, and graphs. We can also set up alerts in Grafana based on OCI data to notify you of important events or issues.
In this blog post, I will demonstrate how to use Grafana for real-time monitoring and visualization of GoldenGate data from OCI metrics. The following topics are covered.
- Installing Grafana on Compute VM
- Network & Security changes at OCI
- Connecting GoldenGate to Grafana
- Creating a Grafana dashboard for OCI GoldenGate
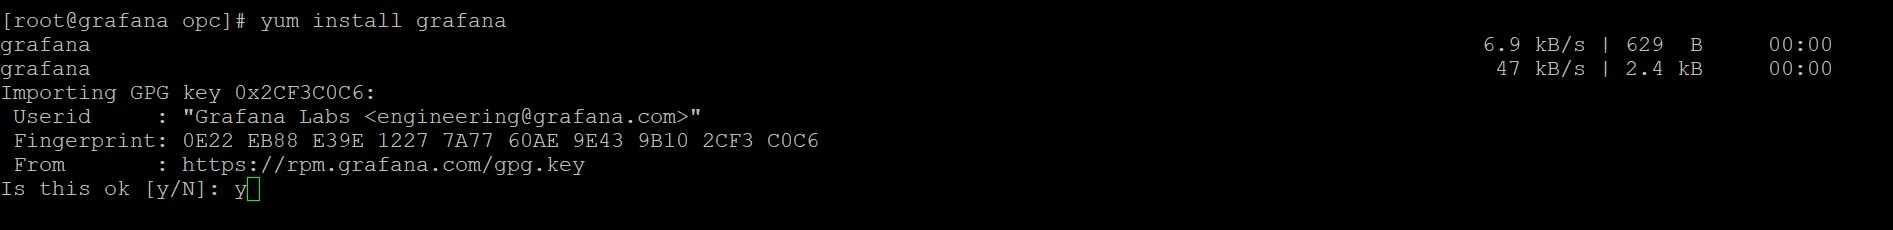
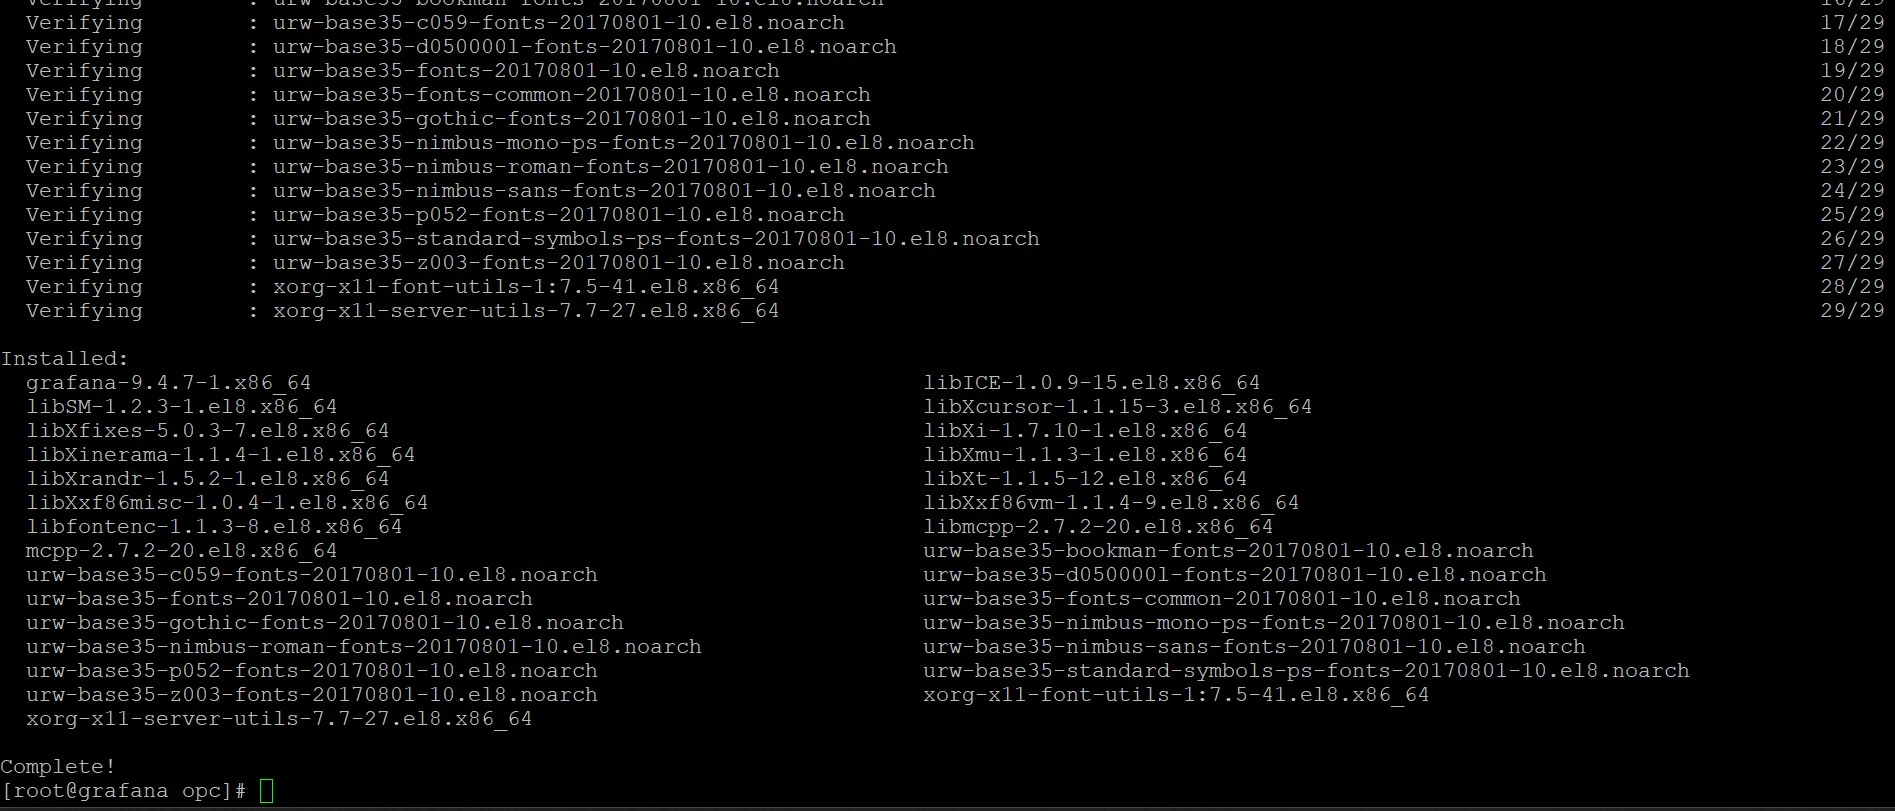
Installing Grafana on Compute VM
Provision a Linux-based compute VM on OCI.
To access the compute VM, you may utilize a tool such as Putty etc.
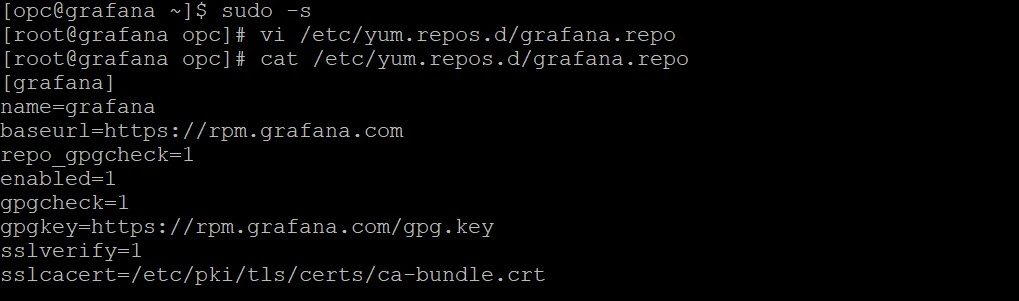
To install Grafana via yum, Create a repository file as follows:
To access the compute VM, you may utilize a tool such as Putty etc.
To install Grafana via yum, Create a repository file as follows:
					[opc@grafana ~]$ sudo -s
[root@grafana opc]# vi /etc/yum.repos.d/grafana.repo
[root@grafana opc]# cat /etc/yum.repos.d/grafana.repo
[grafana]
name=grafana
baseurl=https://rpm.grafana.com
repo_gpgcheck=1
enabled=1
gpgcheck=1
gpgkey=https://rpm.grafana.com/gpg.key
sslverify=1
sslcacert=/etc/pki/tls/certs/ca-bundle.crt
Install an OCI metrics plugin.
grafana-cli plugins install oci-metrics-datasource
grafana-cli plugins install oci-metrics-datasource

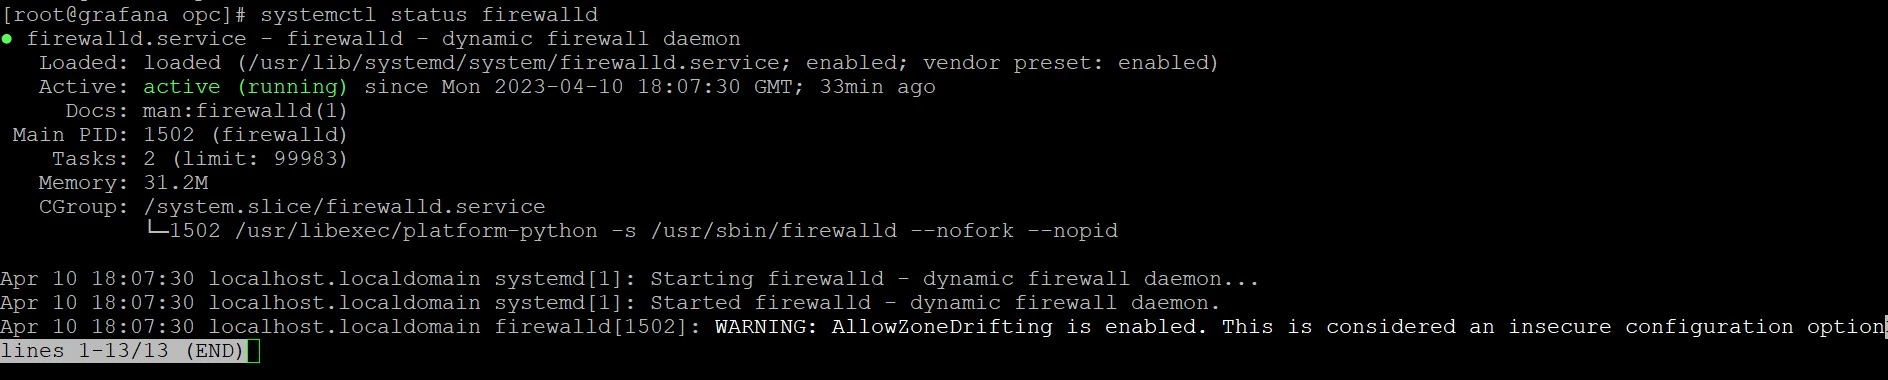
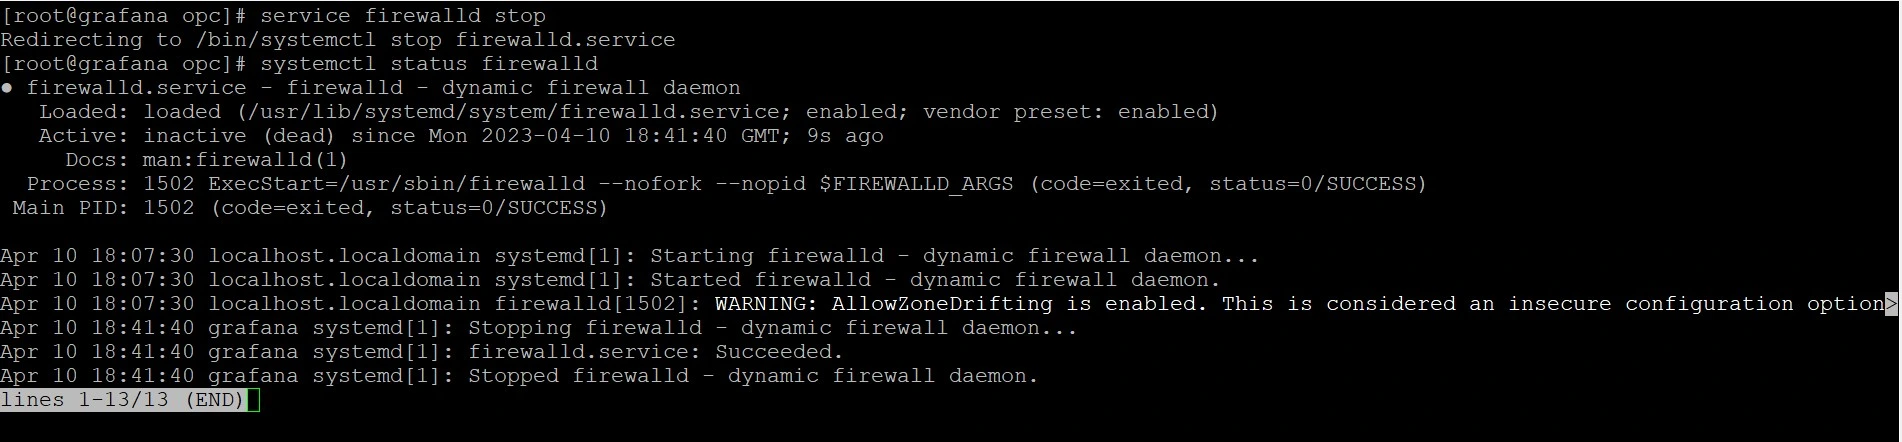
Check the firewall status and stop at OS level for the compute VM
systemctl status firewalld
service firewalld stop
systemctl status firewalld
service firewalld stop
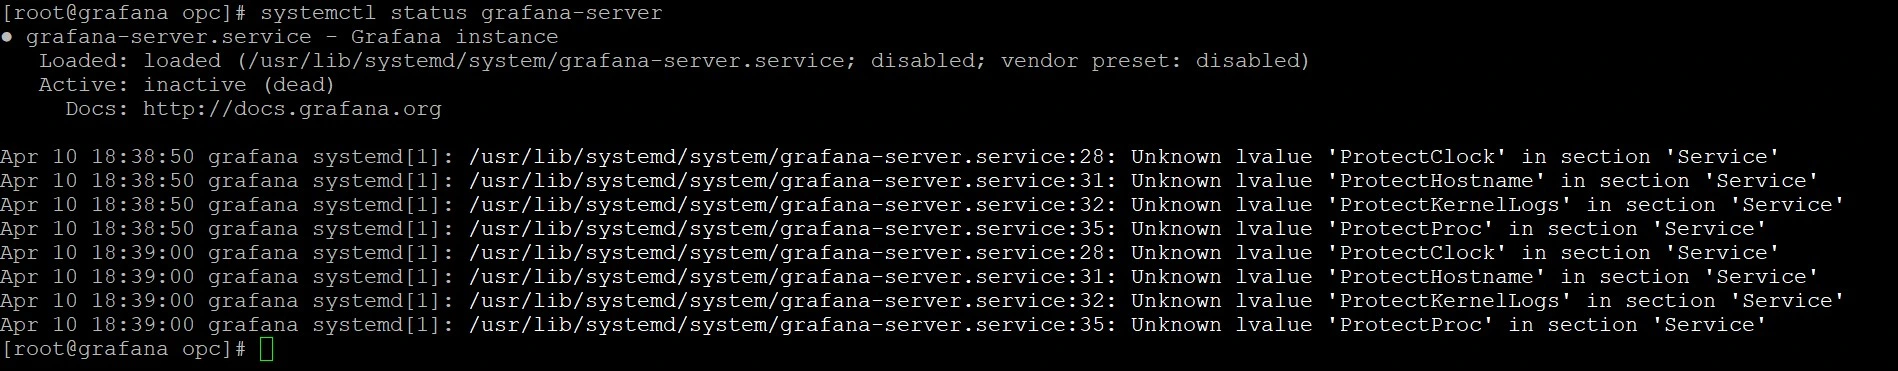
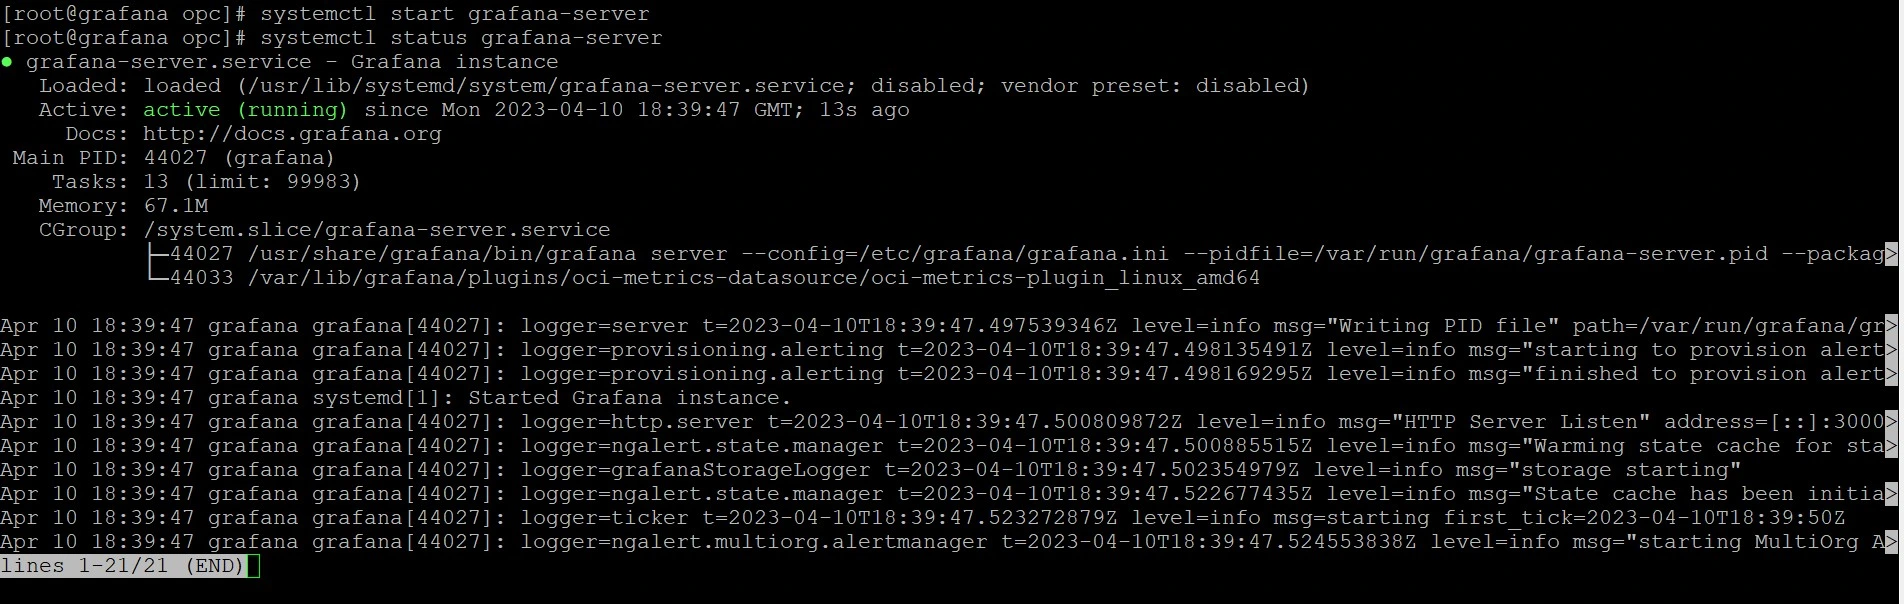
Check the status of Grafana and start if it is not running
systemctl status grafana-server
systemctl start grafana-server
systemctl status grafana-server
systemctl start grafana-server
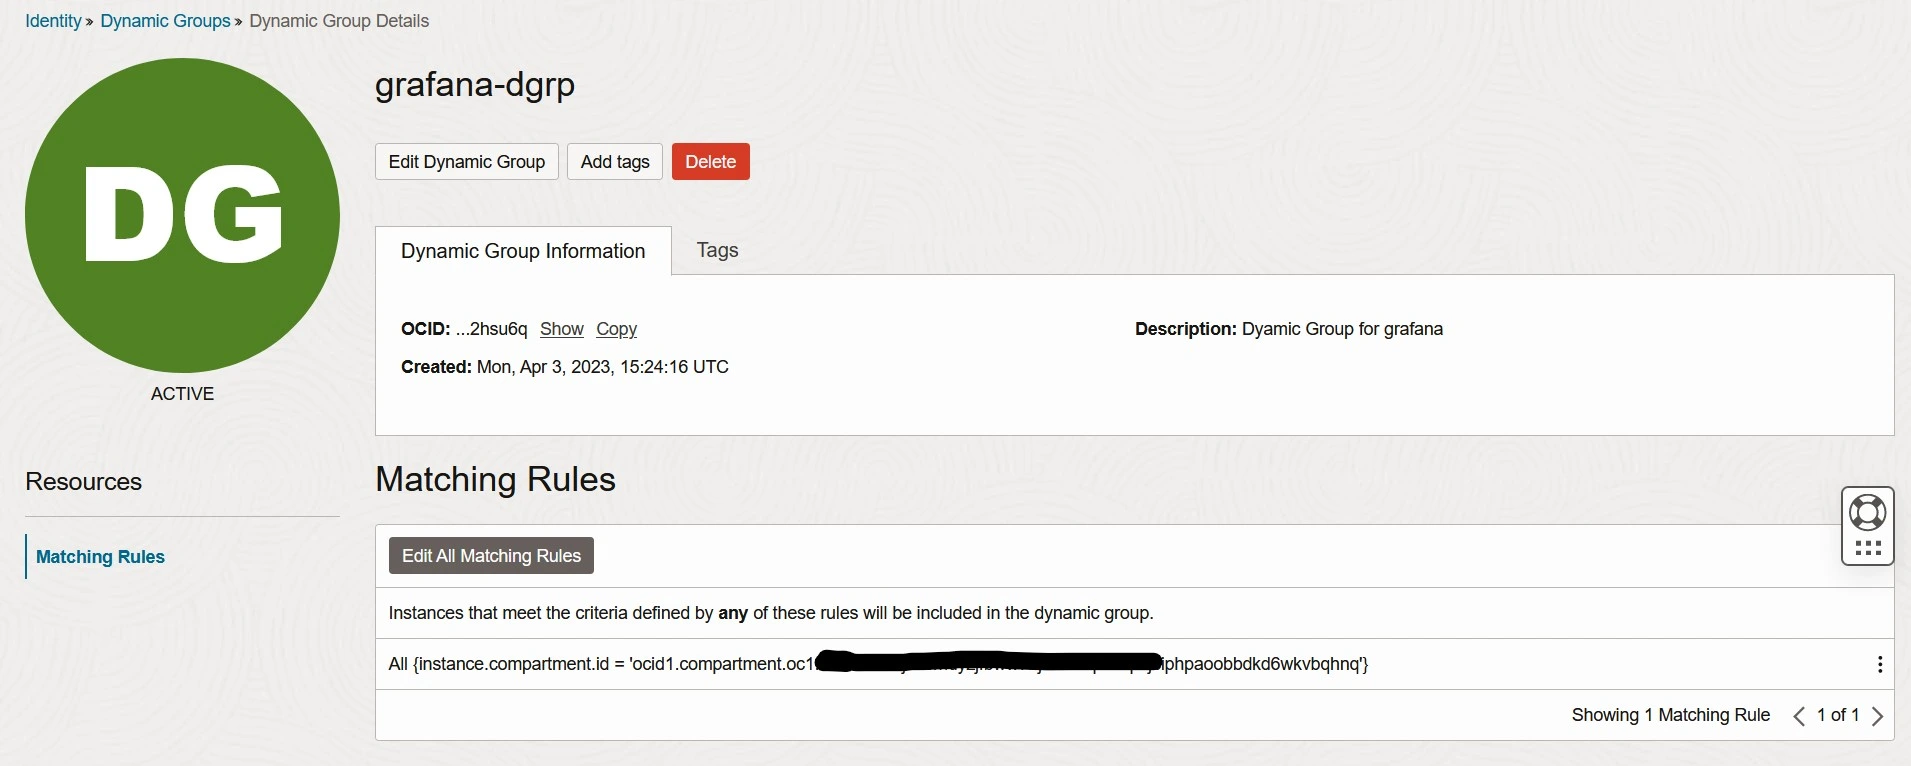
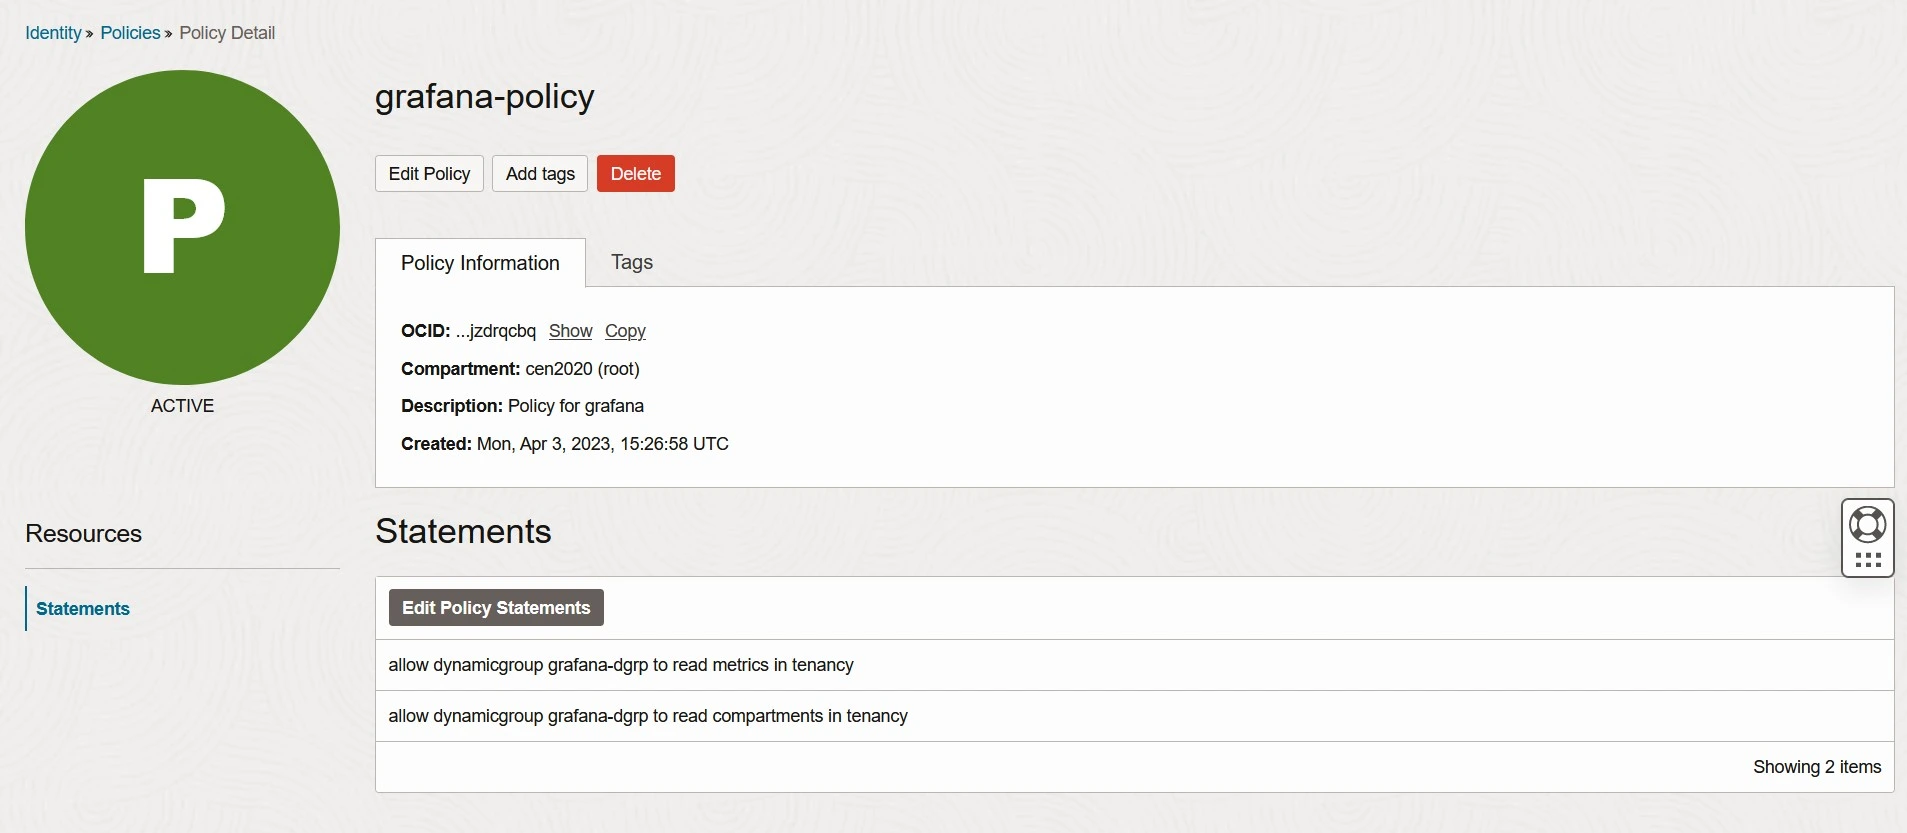
Network & Security changes at OCI
Creating a dynamic group and policies for Grafana on OCI can help simplify access management and improve security by automatically granting appropriate access to Grafana resources based on predefined criteria for the OCI Metrices.
Open port 3000 from security list to access Grafana portal.

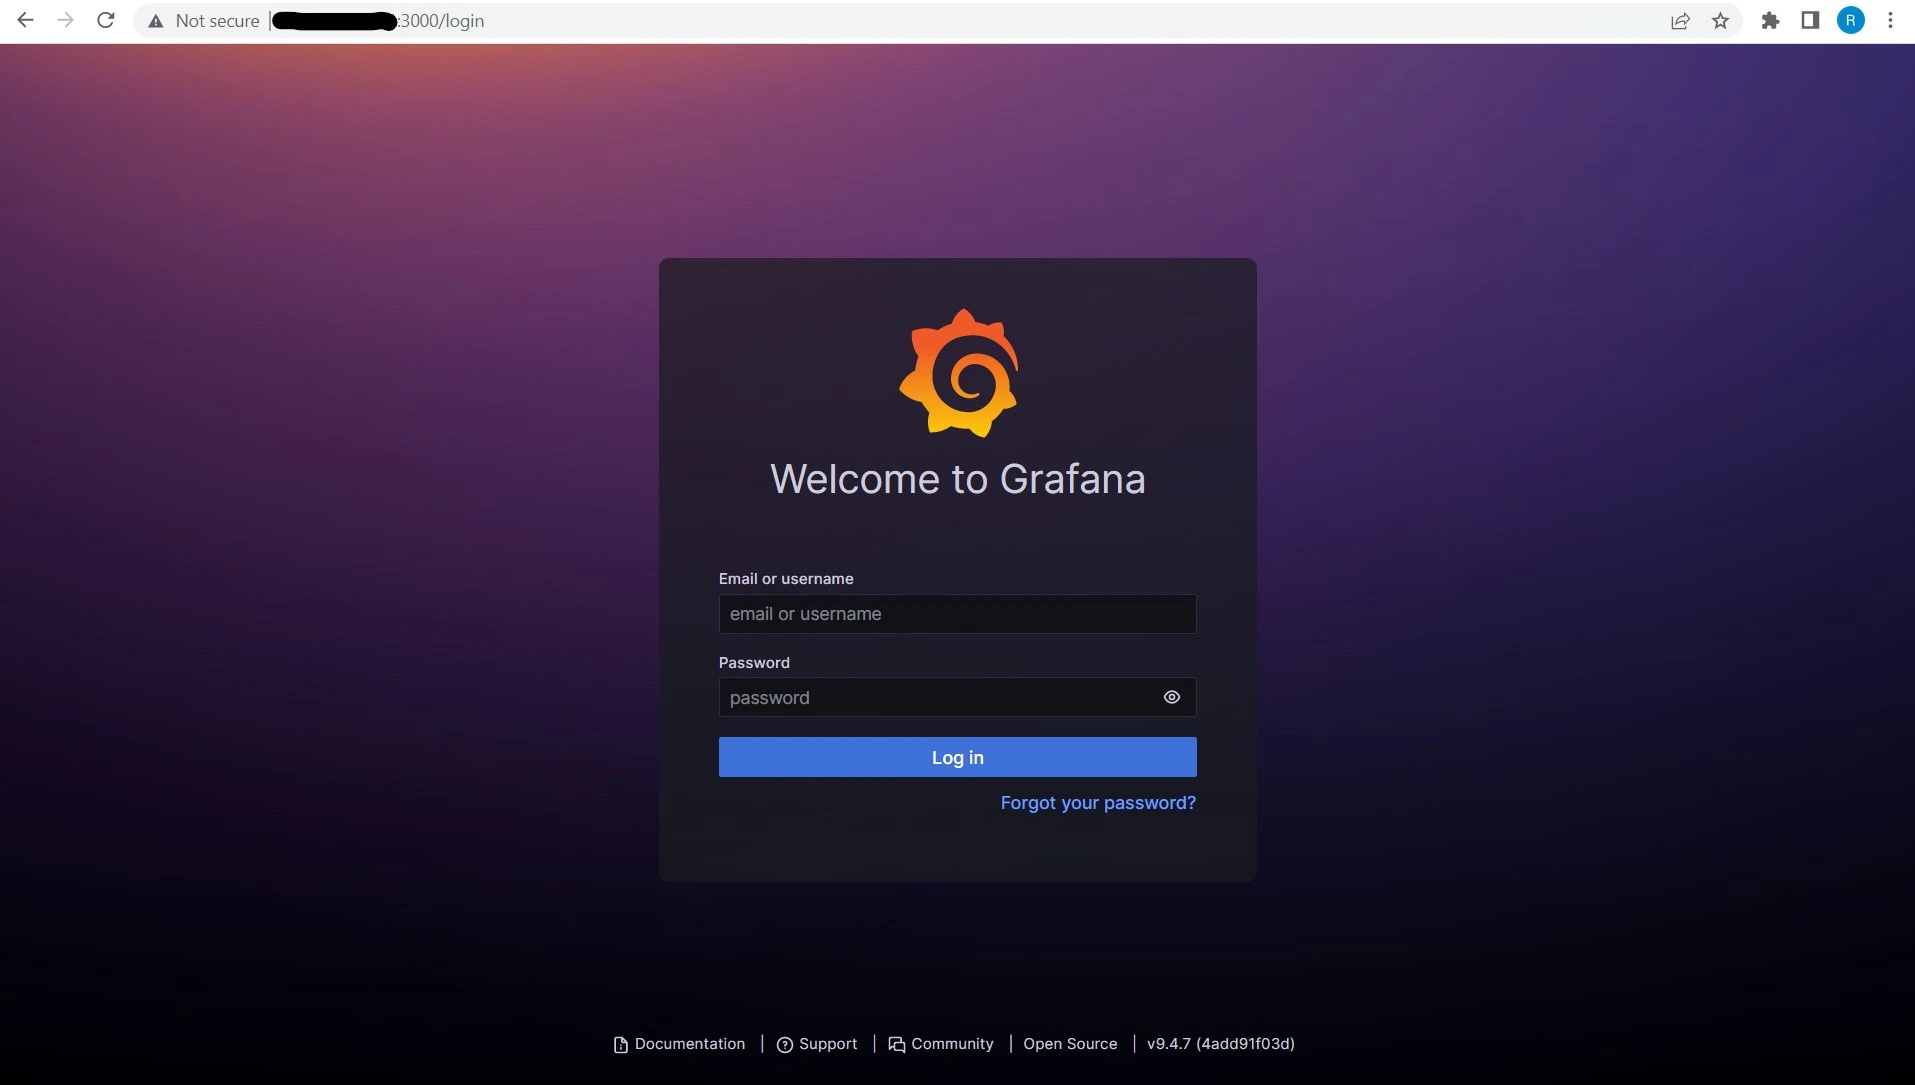
Connecting GoldenGate to Grafana
- To access the Grafana console go to the browser and type http://<ip>:3000.
- The default username and password is admin/admin.
- Password change will be prompted up the initial login.
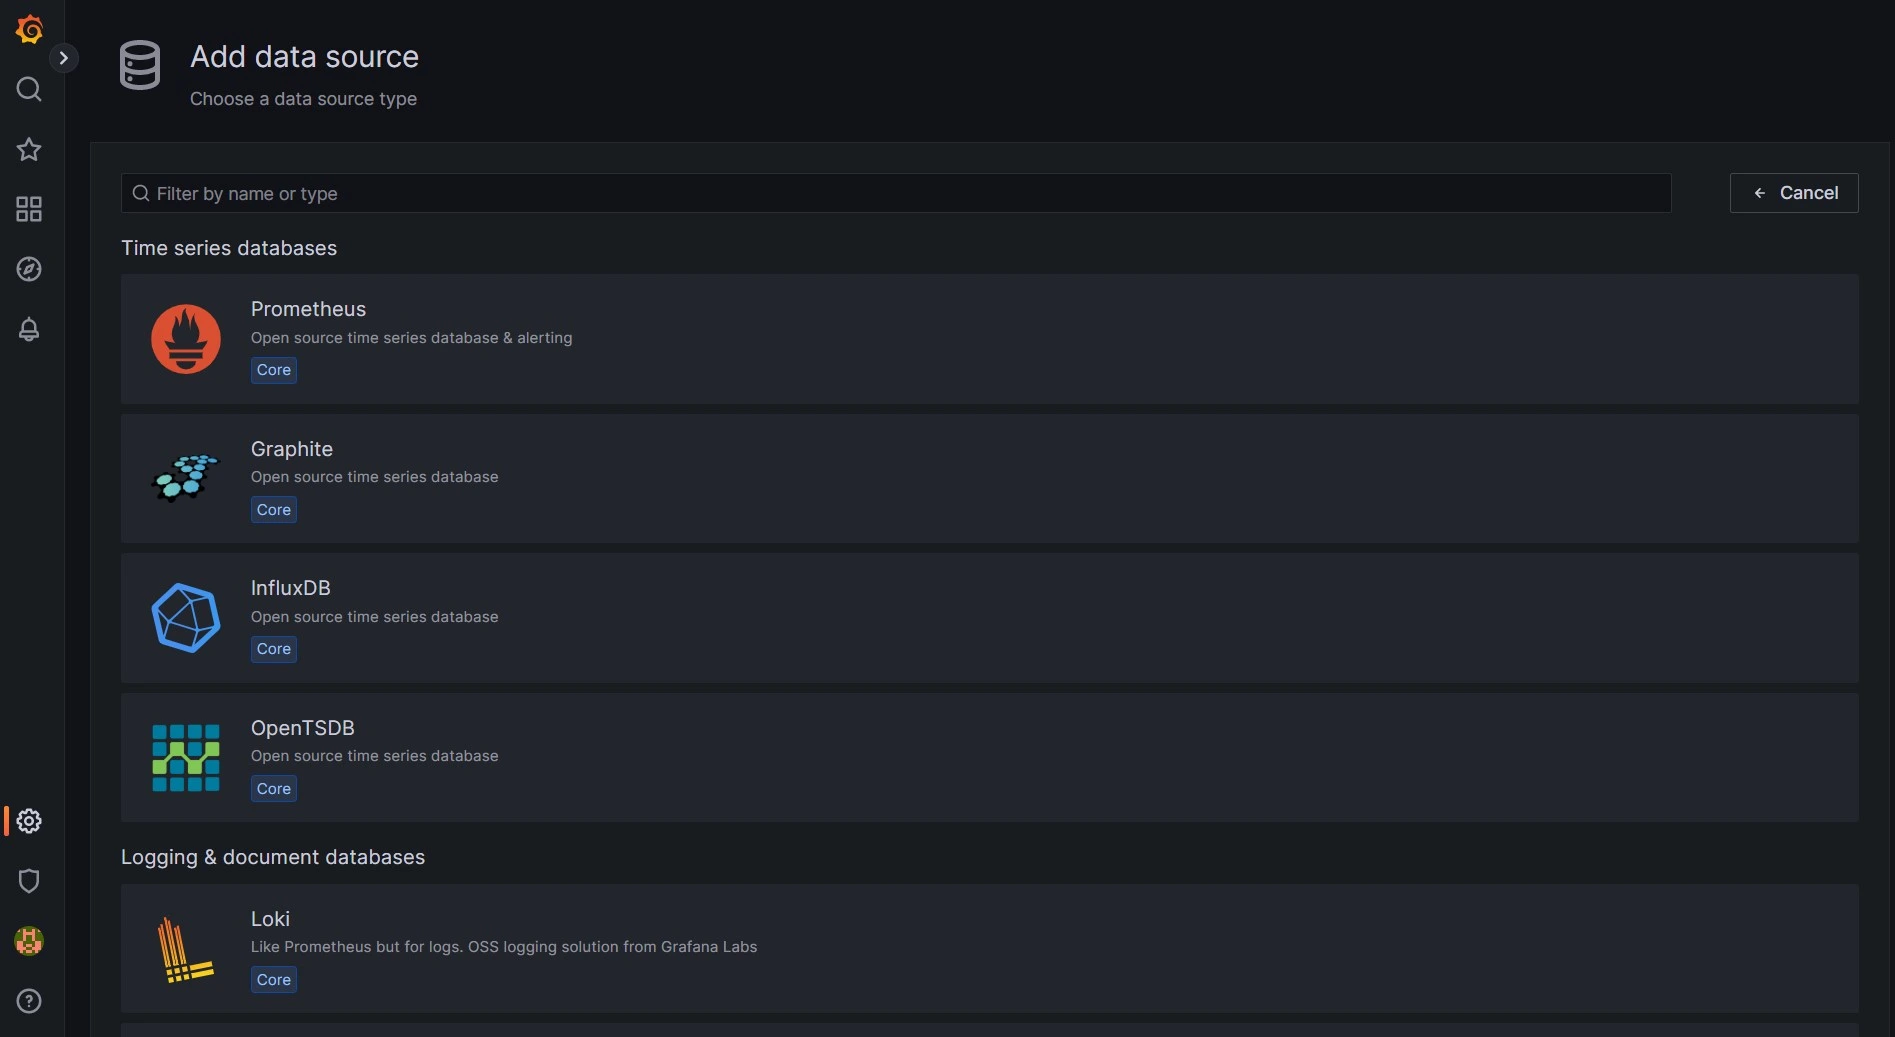
Creating Grafana dashboard for OCI GoldenGate
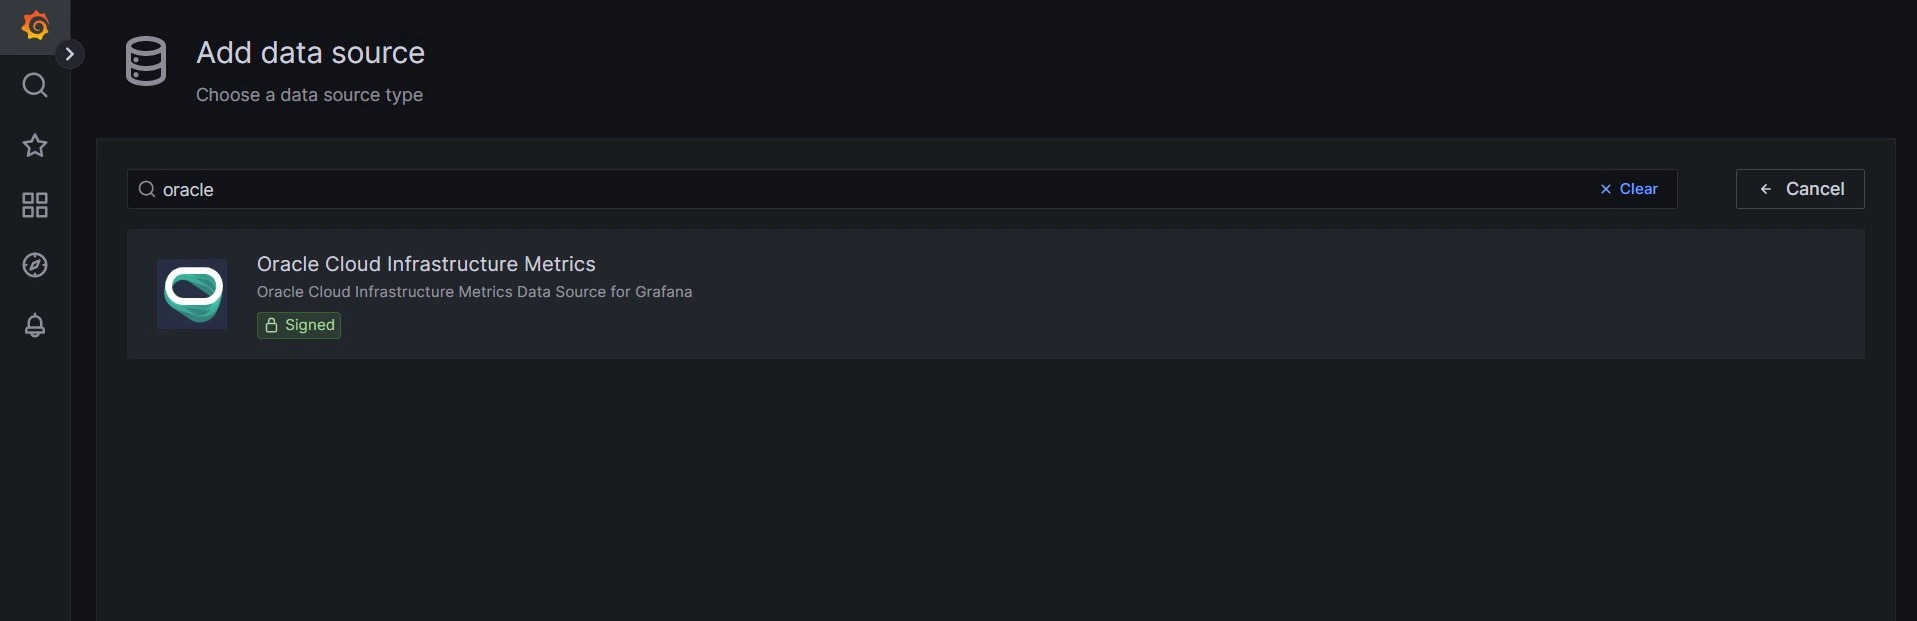
Once logged in to Grafana the next step is to create the data source. Here in this example it is going to Oracle Cloud Infrastructure.
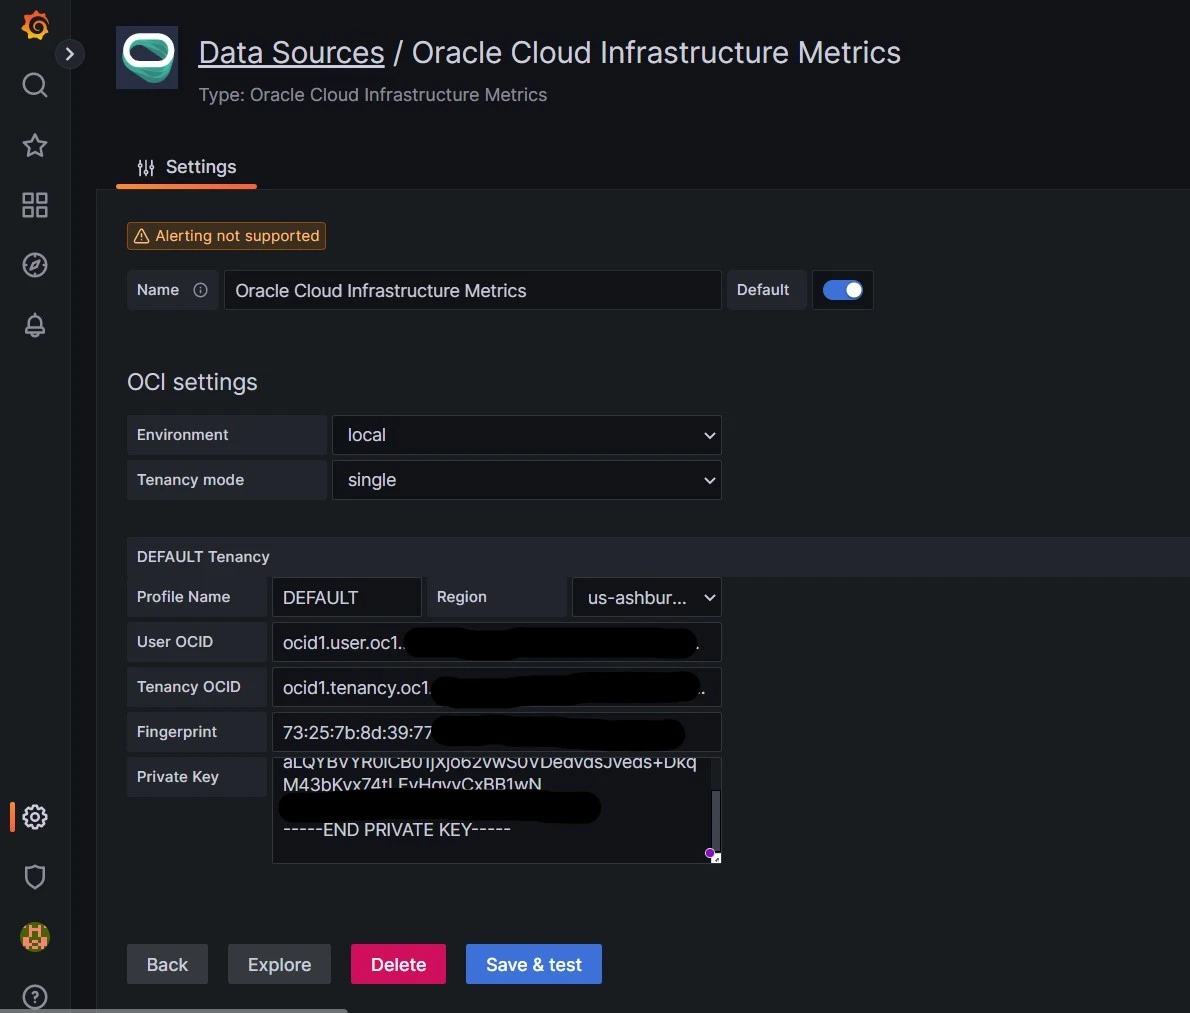
After adding the data source, enter the OCI tenancy details that you intend to monitor.
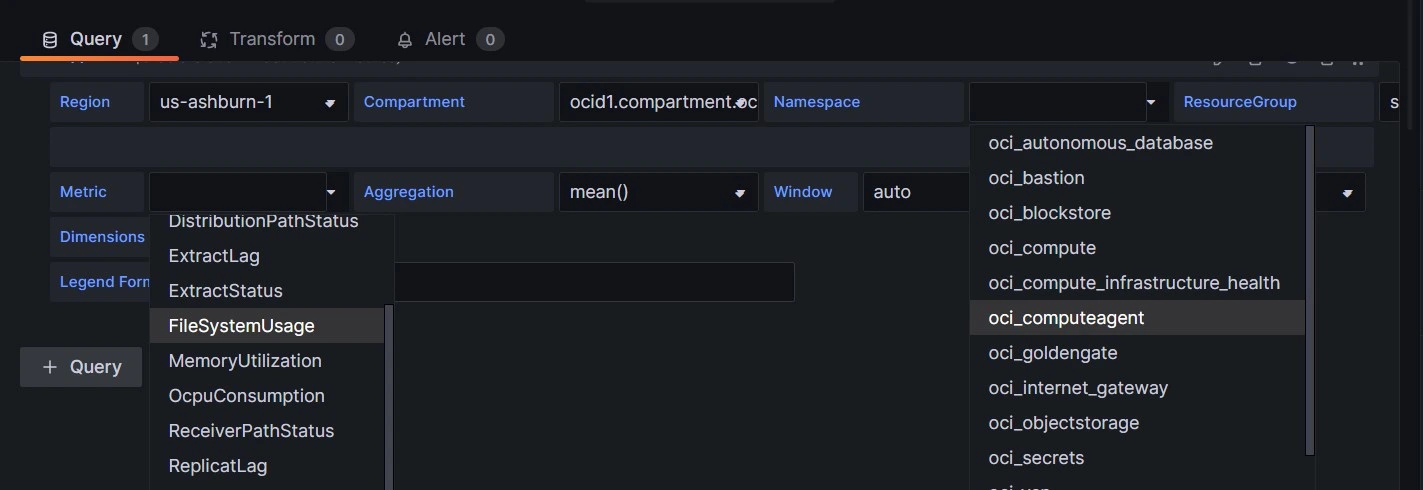
Create a Dashboard and the the below details. select the Region, Compartment, Name space , Dimensions that you intend to monitor in dashboard.
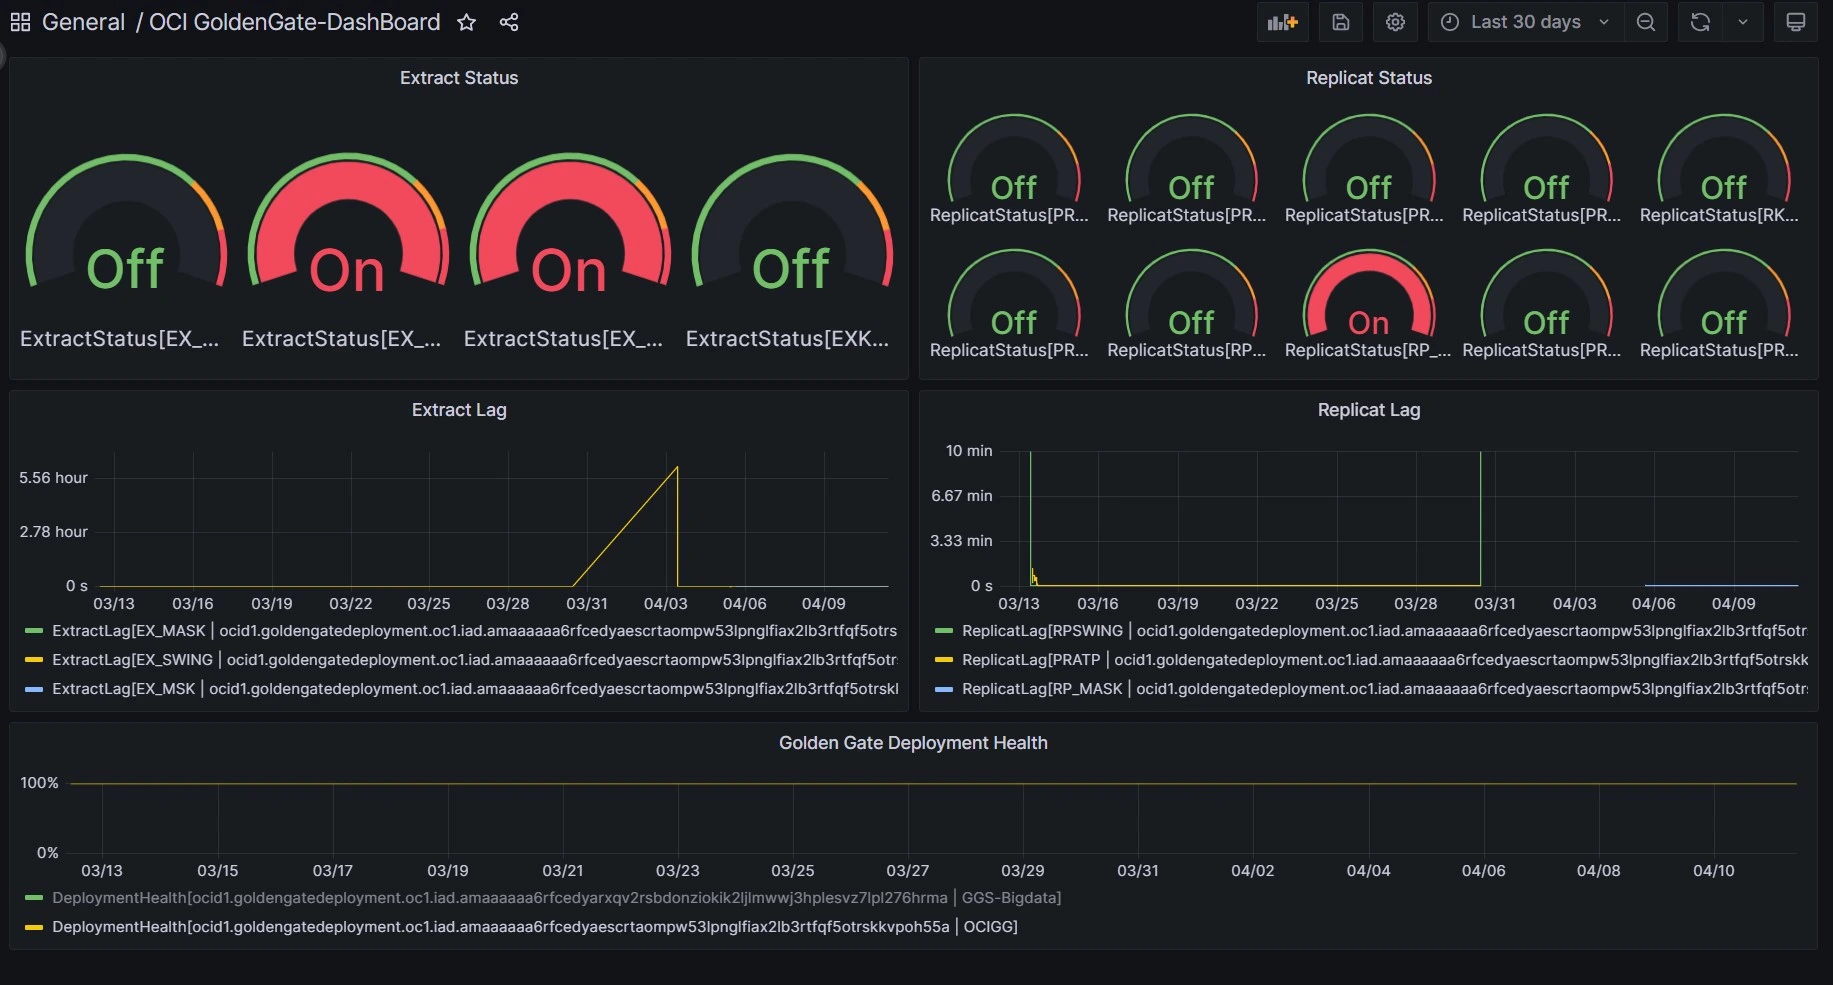
That’s it, once you add panels with Deployment health, extract & Replicat Lag, status will be displayed in Dashboard. Here is a sample Dashboard.
Summary : With the OCI plugin for Grafana, users can easily connect to and query OCI metrics and logs, and create rich dashboards that help monitor the performance and availability of their OCI resources. This is just not limited to GoldenGate, this is one of the example and in a similar way most of the OCI resources can be monitored using Grafana.
For more information about Grafana on OCI, please do refer here.
Hope you found this article useful.
Disclaimer: The views expressed on this document are my own and do not necessarily reflect the views of Oracle..
For more information about Grafana on OCI, please do refer here.
Hope you found this article useful.
Disclaimer: The views expressed on this document are my own and do not necessarily reflect the views of Oracle..